Independent project · Concept, development and operations
Dashboard development with .NET: VSX Pulse
A public statistics website for the Open VSX Marketplace. I collect the data, calculate changes and present it in charts and searchable views.
VSX Pulse live ↗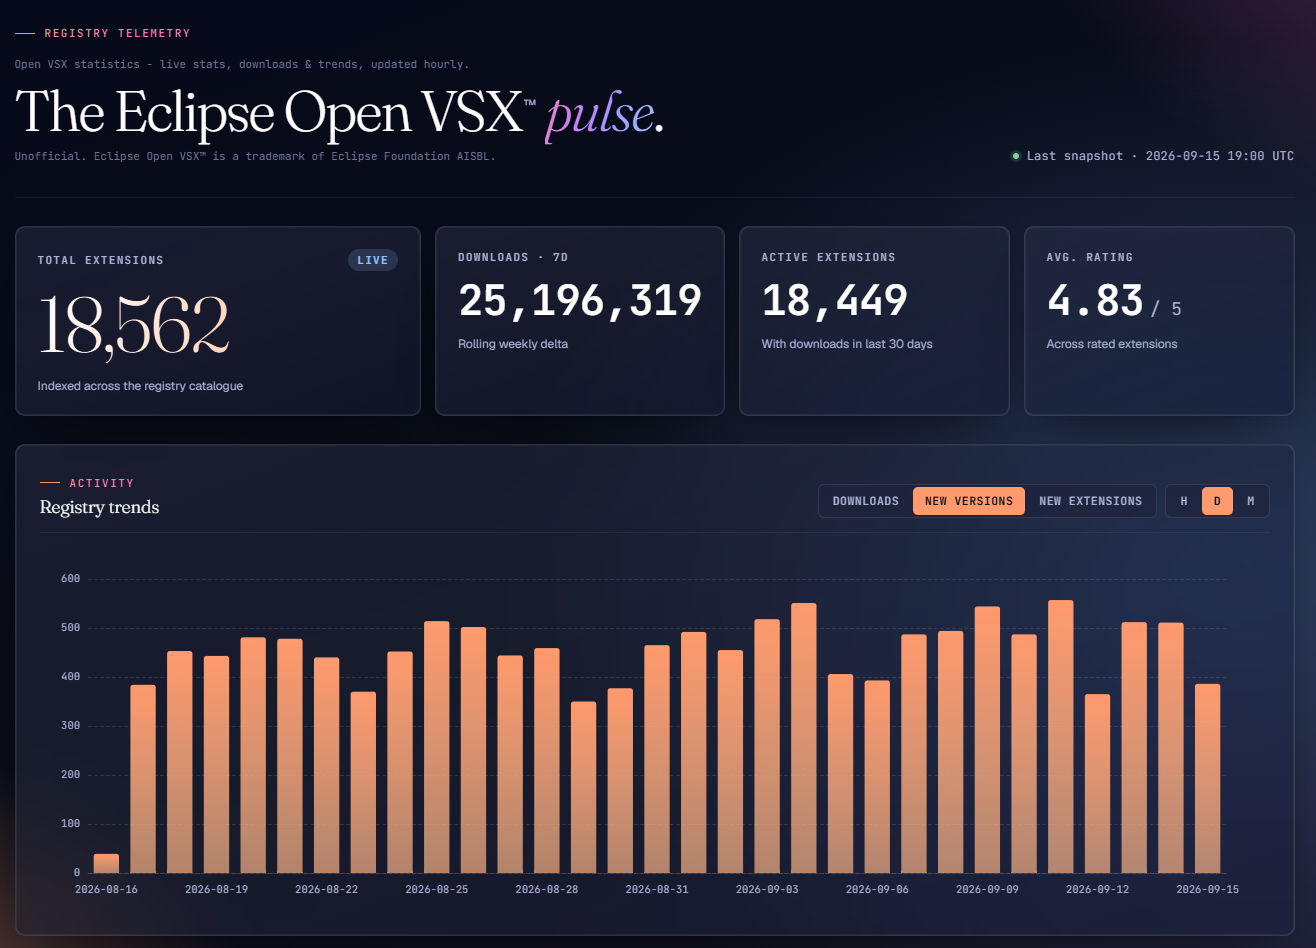
The starting question
Which extensions are gaining downloads right now? A total counter cannot answer that. Open VSX provides cumulative download counts. To understand changes over time, those counts need to be stored regularly and compared.
That led to VSX Pulse, an independent project: a web interface for exploring both the whole marketplace and individual extensions.
From data source to interface
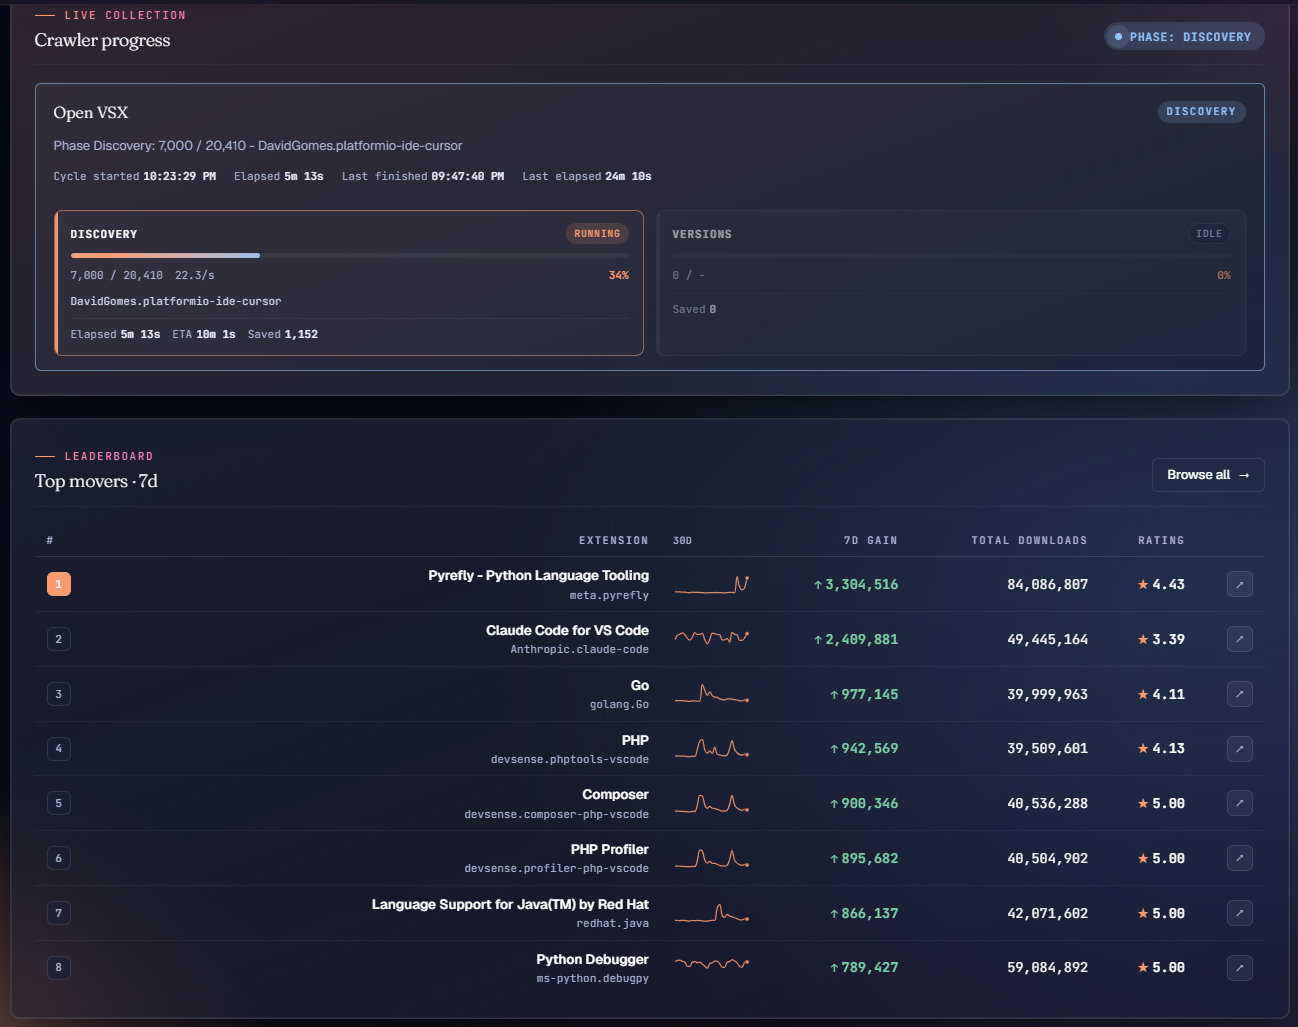
A custom crawler discovers extensions, stores hourly snapshots and collects versions. SQLite holds the data. The backend prepares it for overview pages, search and individual extension pages.
The website uses ASP.NET Core Razor Pages, with ECharts for time series. Visitors can change periods and views and move from the overview to a single extension.
Implementation decisions
Collection and presentation serve different purposes. The crawler collects data in the background; the website reads stored results. A page request does not need to retrieve all its information from the marketplace first.
Trends require a baseline. A single initial snapshot cannot provide a meaningful history. This limitation comes from the data source and is part of interpreting the results.
SQLite keeps storage manageable for this project. The crawler runs as a background service inside the same .NET application. I use Docker for deployment.
The result
VSX Pulse is publicly accessible. It connects collection, storage and presentation: the marketplace overview, time series, search and detail pages all use the same underlying data.
I developed the data pipeline, backend and interface and operate the application. It demonstrates a complete implementation from an external API to usable analytics.
For similar projects
A similar approach can support product statistics, public data portals or internal metrics: collect data regularly, calculate changes and make it accessible through a web interface.
More about web development and data integration →